Technically Speaking – A look at Report Builder in TapRooT® VI
Let’s take a quick look at the Report Builder in TapRooT® VI. We will look at some of the features and elements that can be added to your report in TapRooT® VI and how it can make your reports stand out. But first, I would like to show an example of a finished product then explain how we got the report and help you get an understanding of the different fields for your reports.
PAGE 1
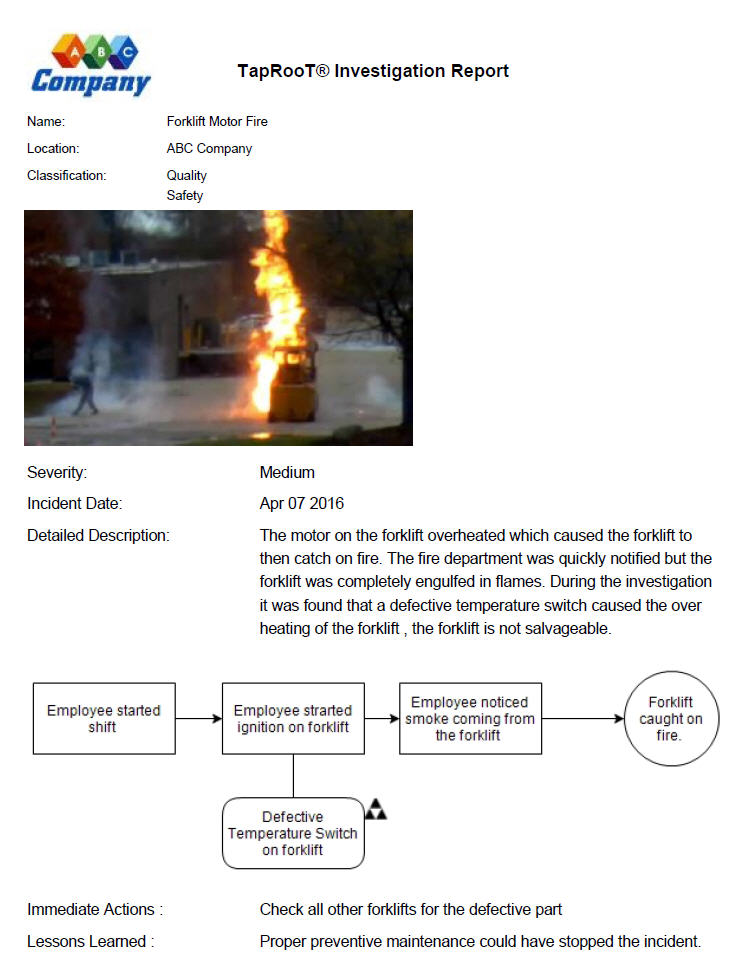
As you can see in the example there are a lot of things that can be shown on the report. The best thing is now you can Customize the report to show what you need it to. Let’s start at the top of the report with the header. Here you are given the options to display your company’s logo and name, the title of the report and the date created (this is the day that the report is run).
In the report, we can use Visual Elements to make sections of your report stand out from the rest. Visual elements like images can have your report make a statement and show how extensive the incident actually was and make an impact when reporting to management. Through the report builder, you are given the option to insert either a large image or a small image like the one on the report example above. Other elements such as line breaks, lines, and page breaks will help you separate investigation information from other information gathered from Custom Tabs(Click here to learn about creating Custom Tabs).
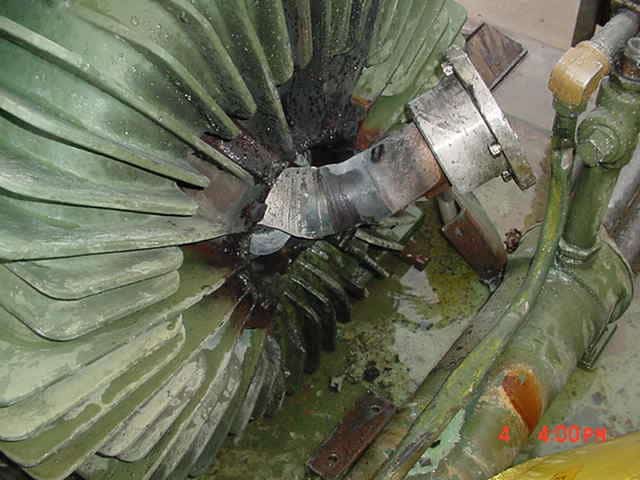
As you can see we included a SnapCap into our report. Are you asking yourself, what is a SnapCap? A SnapCap is simply a SnapCharT® image capture that allows you to take an image of some part of your SnapCharT®. We included a SnapCap that shows our Sequence of Events in our report, but you are given the option to place other SnapCaps that may have been taken.
PAGE 2
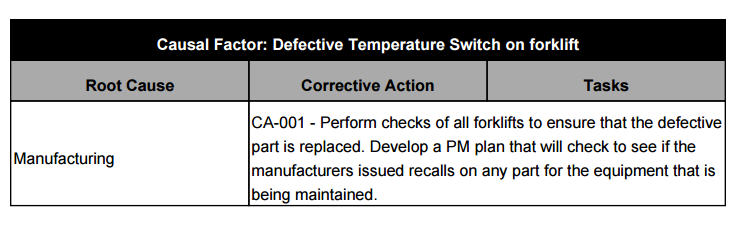
On the second page of our report, we added a table showing our Root Causes and Corrective Actions, grouped by Causal Factor. For your report, you can choose to show each individual fields such as Causal Factors, Root Causes, Generic Causes, Action Plans, and Tasks. Each one of these can be dragged and placed on the report individually in any order, but by choosing to have the table we create an organized view for presenting to the management team.
Other things that can be included in the report are attachments, Investigation Information and any information that was entered into Custom Tabs. Attachments can include pictures of the incident taken during the investigation. Investigation Information includes Name, Incident Date, Incident Time, Location and Classification (and anything else you want to add).
We’ve looked at the different types of information that can be added to your report and items that can make sections of your report stand out. The only thing left to do if for you to construct your own personalized report.
Technically Speaking is a weekly series that highlights various aspects of our Version 5 software, introduces you to the upcoming TapRooT® VI release and occasionally includes a little Help Desk humor.
Remember, just because it’s technical, doesn’t mean it has to be complicated!