Technically Speaking – Building a Management Presentation without PowerPoint
This week in Technically Speaking, we will look at building a management report straight from report builder in TapRooT® VI. In the older version of TapRooT® 5, if you needed to make a presentation for an investigation there were a lot of extra steps that needed to be taken to accomplish this. For example, after the investigation was finished, you could go to the 7th step, and select the Investigation Report link. You could then view the investigation report, causal factor report, and so on. Then, if you needed to make a presentation for these reports, they needed to be exported and then powerpoint needed to be opened and screenshots needed to be taken, then posted in powerpoint just to make a presentation. Well, now that’s all in the past.
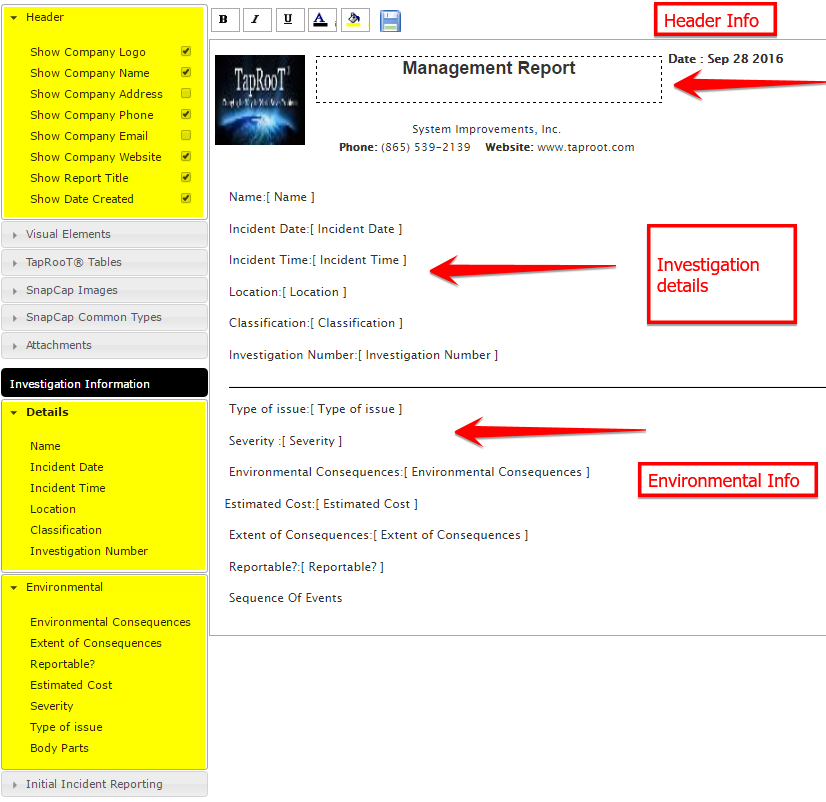
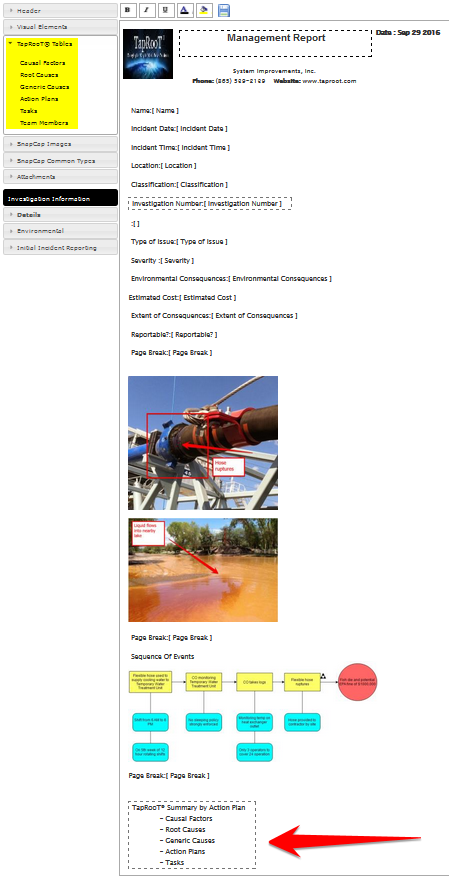
For the start of our management report, we can add company information as well as, details about our incident. As you can see below, we get the company information from the “Header” section pointed out by the top arrow. This information can be added or taken away by simply checking/un-checking the boxes in the “Header” section pointed out in the example. Below the company information, we have the incident details pointed out by the second arrow. As you can see, the details section provides the name, date, time, location, classification, and investigation number of the incident. Also, if this is an environmental incident, which is what this incident was, you can add in that information as well. This is outlined by the third arrow.
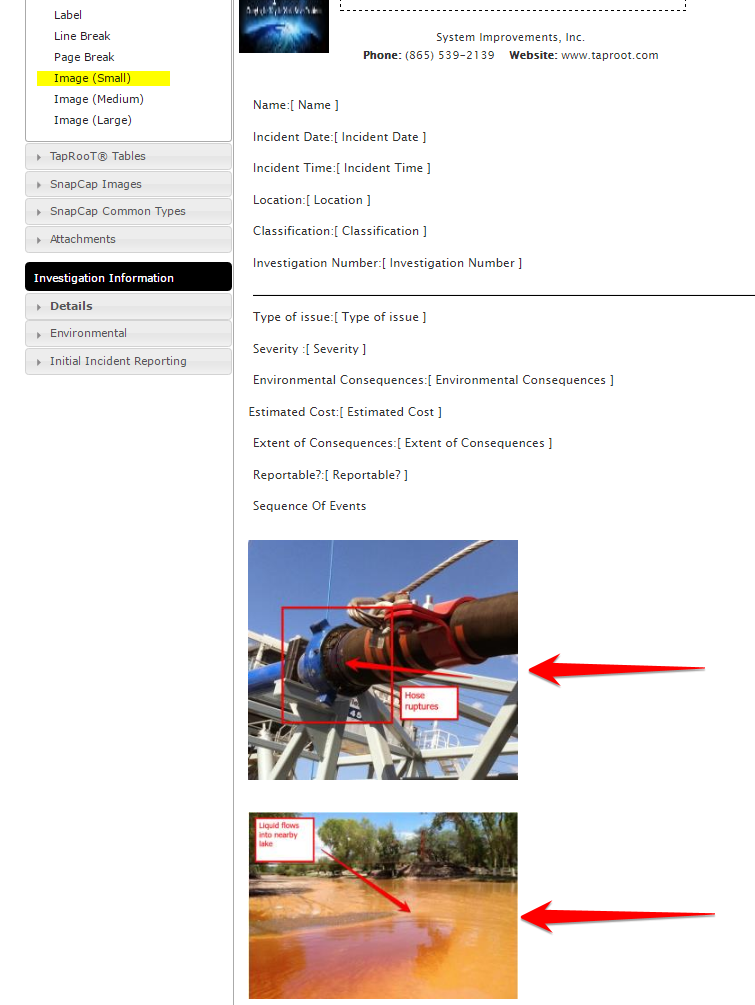
Next, we need some visual images for our report. Having visual images is a very important because it helps the audience picture the problem that occurred. In the picture provided below, notice how we have provided a picture of our equipment that failed along with a picture of the end result of the failure. With these pictures and a brief verbal description of what happened, we have provided an easy but detailed image for our audience.
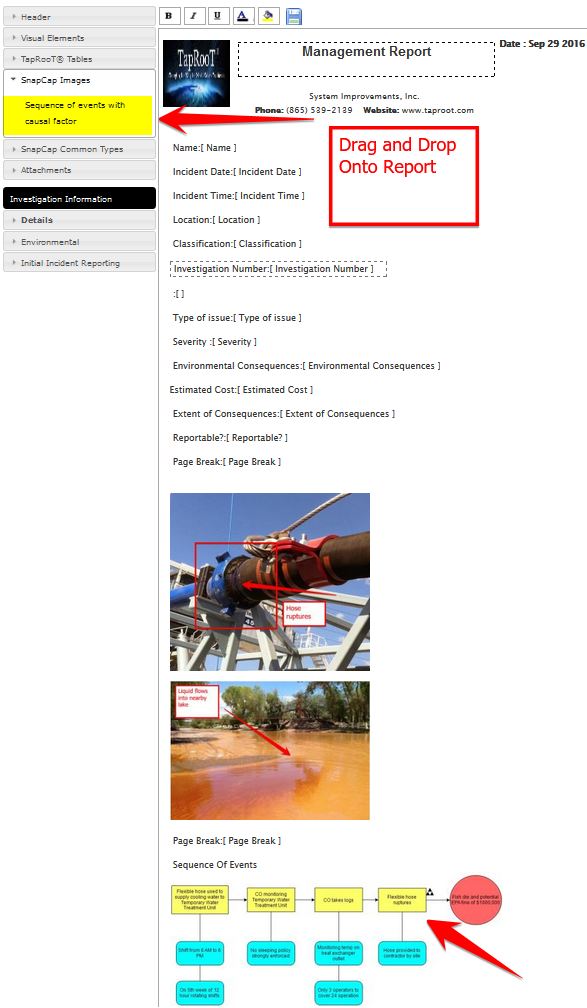
Now that we have given the audience a nice visual of the cause of the incident, we need to include the sequence of events that led up to our incident. We can take a SnapCap of the sequence of the events, include a causal factor straight from the SnapCharT® and put them directly onto our report. (If you need a refresher on this feature please refer to our blog post titled Technically Speaking- What is a SnapCap?)
The last thing we need to look at for our management report is adding tables. You are able to add tables of the root causes that contributed to the causal factors that were found. Next, add a table of generic causes along with the action plan being put in place that would potentially fix the issue at hand in the future. The picture below shows the tables that will be listed on the final report.
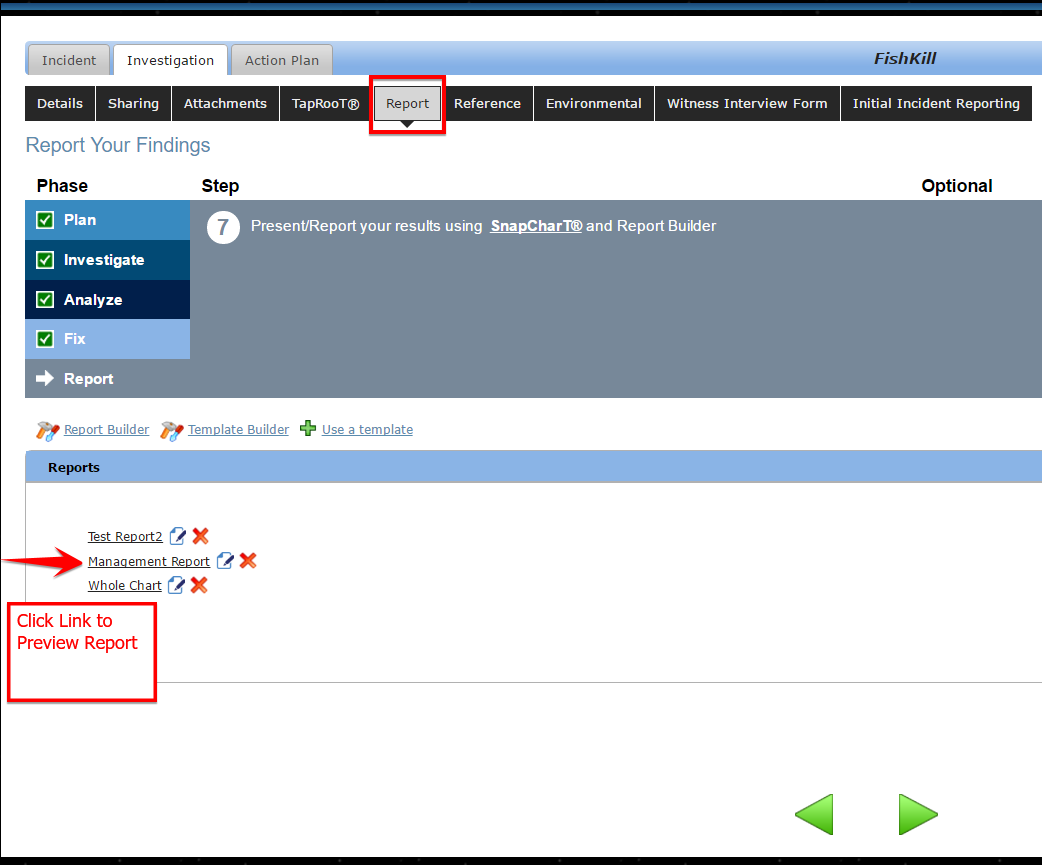
Now, we have a complete report ready to preview. To do so, go back to the investigation, select the [Report] tab, and then select the link to the report. This report is named Management report, so this is the one selected. After this is selected, a .PDF will be generated. This .PDF can either be downloaded to the machine and saved or printed out.
Provided below is a .PDF link to the final report created.
[gview file=”http://www.taproot.com/content/wp-content/uploads/2016/09/Management-Report.pdf”]
Report builder is such an important feature that comes with the TapRooT® VI software. There is no more need to use third party software to generate management reports or presentations. Just complete the investigation, gather the details and facts, then simply drag and drop into the report builder and you are good to go!
Technically Speaking is a weekly series that highlights various aspects of the TapRooT® VI software and occasionally includes a little Help Desk humor.
Remember, just because it’s technical, doesn’t mean it has to be complicated!