Root Cause Analysis on Trends

Welcome to this week’s root cause analysis tips. This week I would like to talk about root cause analysis on trends.
One of the most common discussions I have with people involves what to do with the things you do not have time to investigate. Many companies use some sort of ranking or risk matrix to determine at what point something is important enough to warrant an investigation. I have some thoughts on this…
Sometimes people try to investigate everything and end up doing poor investigations.
First of all, sometimes people try to investigate everything and end up doing poor investigations on everything; that does not help anybody. One consideration on where to draw the line is related to your current numbers. For example, if you work in a plant that has a few incidents per year, if you have the resources to investigate, I say do it. But if you are looking at large numbers at a corporate level, you may not have the resources – and you have to decide where to draw the line.
So what about the minor incidents you have that don’t get investigated – what to do with them? Well, it goes beyond minor incidents, you have other things that can be trended, rootcaused (is that a word?), and corrected. It is actually quite easy to investigate a trend, the hard part is actually collecting the data. I call this getting things in the “right bucket.” Here are some examples of information you might collect (or should):
• Minor incidents
• Near Misses
• Audit Findings
• BBS Observations
If you do a good job of collecting data, you can then trend the information. Your trends should reveal what processes are causing you pain. You then investigate the PROCESS, rather than an incident. For example, let’s say you had some near misses, some audit findings, and some BBS observations related to your lockout/tagout process that revealed issues. You may have not had a major incident yet, but you have warning signs. You can’t (or don’t have time to) go back and do full blown investigations on each data point, so you map out the process with a SnapCharT®, adding everything you know about the process as conditions, and based on that information, you identify your known failures and potential failures as Significant Issues (the equivalent to Causal Factors) in TapRooT®. Then off to the Root Cause Tree® and corrective actions. You’ve done ONE investigation on potentially dozens (or hundreds) of issues. This is more effective and much easier than doing multiple bad investigations.
Investigation of trends is a very important consideration in Audit Programs. Again, do you have time to investigate every finding? Maybe not. Here is an example:
A corporate auditor for a big box store has 100 compliance questions on a checklist and 100 locations that were audited using this checklist in the past year. That is a fair amount of data. The auditor can use this data to develop a list of top findings and then analyze the biggest issues.
The data for the yearly compliance is presented on a Pareto Chart below.
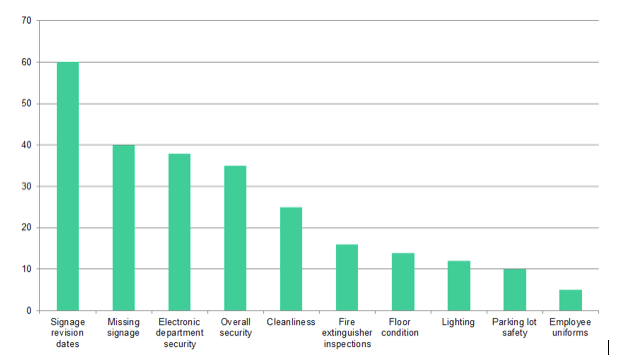
The top two categories are related to a similar topic: required signage. The audits have revealed both missing signs and outdated signs. Let’s look at these issues together on a SnapCharT®. Significant Issues are marked with a triangle:
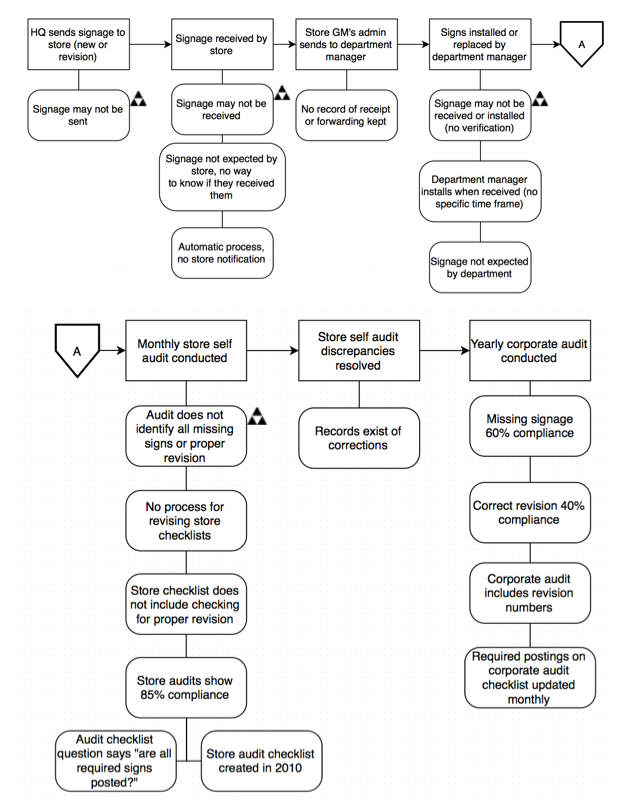
Next, you take the Significant Issues through the Root Cause Tree®, and apply corrective actions. One investigation on dozens of findings.
I hate to use clichés, but WORK SMARTER NOT HARDER!
If you already collect good information and have good trending in place, consider attending the new TapRooT® for Audits Course on May 4-5.
Thanks for taking the time to read the blog, and happy auditing.