Root Cause Analysis Tip: 3 Tips for Drawing a Better SnapCharT®
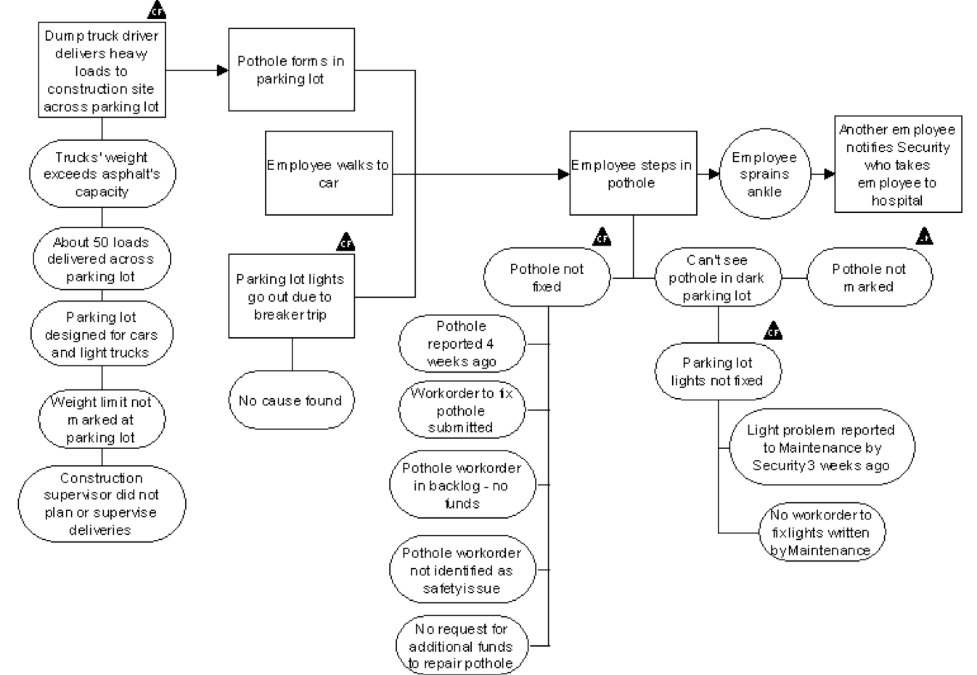
Visualize each step of an incident with a SnapCharT®.
It’s nearly impossible to conduct a useful root cause analysis unless you actually have some data to analyze. Many systems seem to think that you can dive right into an analysis before you have a full understanding of what actually happened. During the development of the TapRooT® System, one of the first items of business was to develop an easy way to visualize the problem and document the gathered facts. Thus, SnapCharT® was born.
SnapCharT®s are pretty easy to build. With just three shapes to worry about, and a few simple rules, the SnapCharT® gets you moving in the right direction right from the get-go.
Here are a few tips to help make the SnapCharT® even easier and more useful.
1. Avoid the word “and” in your Events. Events are meant to show a single action that occurred in the course of the incident investigation. Some people have an aversion to having a bunch of Events, and therefore put several actions in each one. For example, if I wanted to document that the driver stopped at the stop sign, looked both ways, and then pulled out into the intersection, I would not want to write this as a single Event. This should be 3 separate (short) Events, one after the other.
The reason this is important is because we want to see if any mistakes are made during each step in the sequence of events. If we put several actions into a single Event, we find it is easy to miss one of these mistakes. On the other hand, with 3 separate Events, I can ask, “Did the driver make a mistake while stopping? Did she make a mistake while looking both ways? Did she make a mistake by pulling forward?” Having separate Events makes it much easier to catch individual problems.
Keep in mind that, later in the investigation, you may find that there were no mistakes made in any of these Events. When you complete your SnapCharT®, it might then make sense to combine some Events to make the final SnapCharT® easier to read. It is OK to combine Events later on; just leave them separate during your initial data-gathering phase.
2. Leave lots of space. Many people tend to cram all their Events close together, I suppose to conserve real estate. Don’t worry about it; leave lots of room between your individual Events. Spread everything out. You’ll be adding Conditions underneath each of these Events, and you’ll almost certainly end up moving everything to make room for these Conditions anyway. Give yourself plenty of room to work at the beginning. If using the software, I usually only put 2 or 3 Events on each page to start out. Later on, once you have all of your Conditions documented and grouped, you can compress everything down a bit and get rid of extra spaces. But even then, don’t try to squeeze everything tightly together. It can make it hard to read, even after everything is set. And you might also find new Conditions that need to be added once you start the root cause analysis.
3. Draw your lines at the very end. It is tempting to start drawing lines early in the process. You want to see those arrows showing your progression from one Event to the next. And you want to arrange your Conditions into neat groups right from the start. Unfortunately, this can cause problems later on. There is a good chance you’ll be adding new Events, changing the order of the Events you have, or regrouping your Conditions into Causal Factor groups. If you have already drawn your lines, you’ll just have to delete them, make your changes, and then draw them back in. And then probably do it again later on.
I normally don’t draw any lines between Events or Conditions until after I’ve identified my Causal Factor groups. My SnapCharT® is probably pretty close to being complete by that point, so I’m reasonably confident that I won’t be making a lot of changes. This can be a tough lesson for those that are REALLY detail oriented (you know who you are!), and just have to have those lines drawn in early in the process. Resist the temptation; it’ll save you some time (and frustration!) later on.
Let me know what you think about these tips. If you have other tips that you’ve found that make it easier and quicker to produce your SnapCharT®s, share the best practices you’ve learned in the comments below.
We hope that you will also consider coming to the 2016 Global TapRooT® Summit, San Antonio, Texas, August 1-5 to share best practices. Click here to learn more about the Summit.