Tricks for Drawing a Great SnapCharT®: A TapRooT® TV Video Premiere

Although it has been compared to a flowchart, the fact-finding tool—known as the TapRooT® SnapCharT®—is more in-depth.
Beginning your investigation can sometimes be quite a challenge. Deciding who to talk to, what documents you need, what questions you need to ask, etc. can lead to feeling slightly overwhelmed.
Listen to TapRooT® professionals Tim Diggs and Benna Hughes in this detailed discussion about making a SnapCharT®.
You can join TapRooT® TV video premieres via YouTube or Facebook Live around 12:00 pm every Wednesday. If you cannot make the video premiere, access the video later on YouTube or Facebook Live, or access the TapRooT® podcast channel on iTunes, Stitcher, and more.
Now, about that SnapCharT®
TapRooT® Instructor Ken Reed has a favorite quote from General Creighton Abrams about the SnapCharT® process:
“WHEN EATING AN ELEPHANT, TAKE ONE BITE AT A TIME.”
In other words, you just need to get started with the first step, and then methodically work your way through to the end.
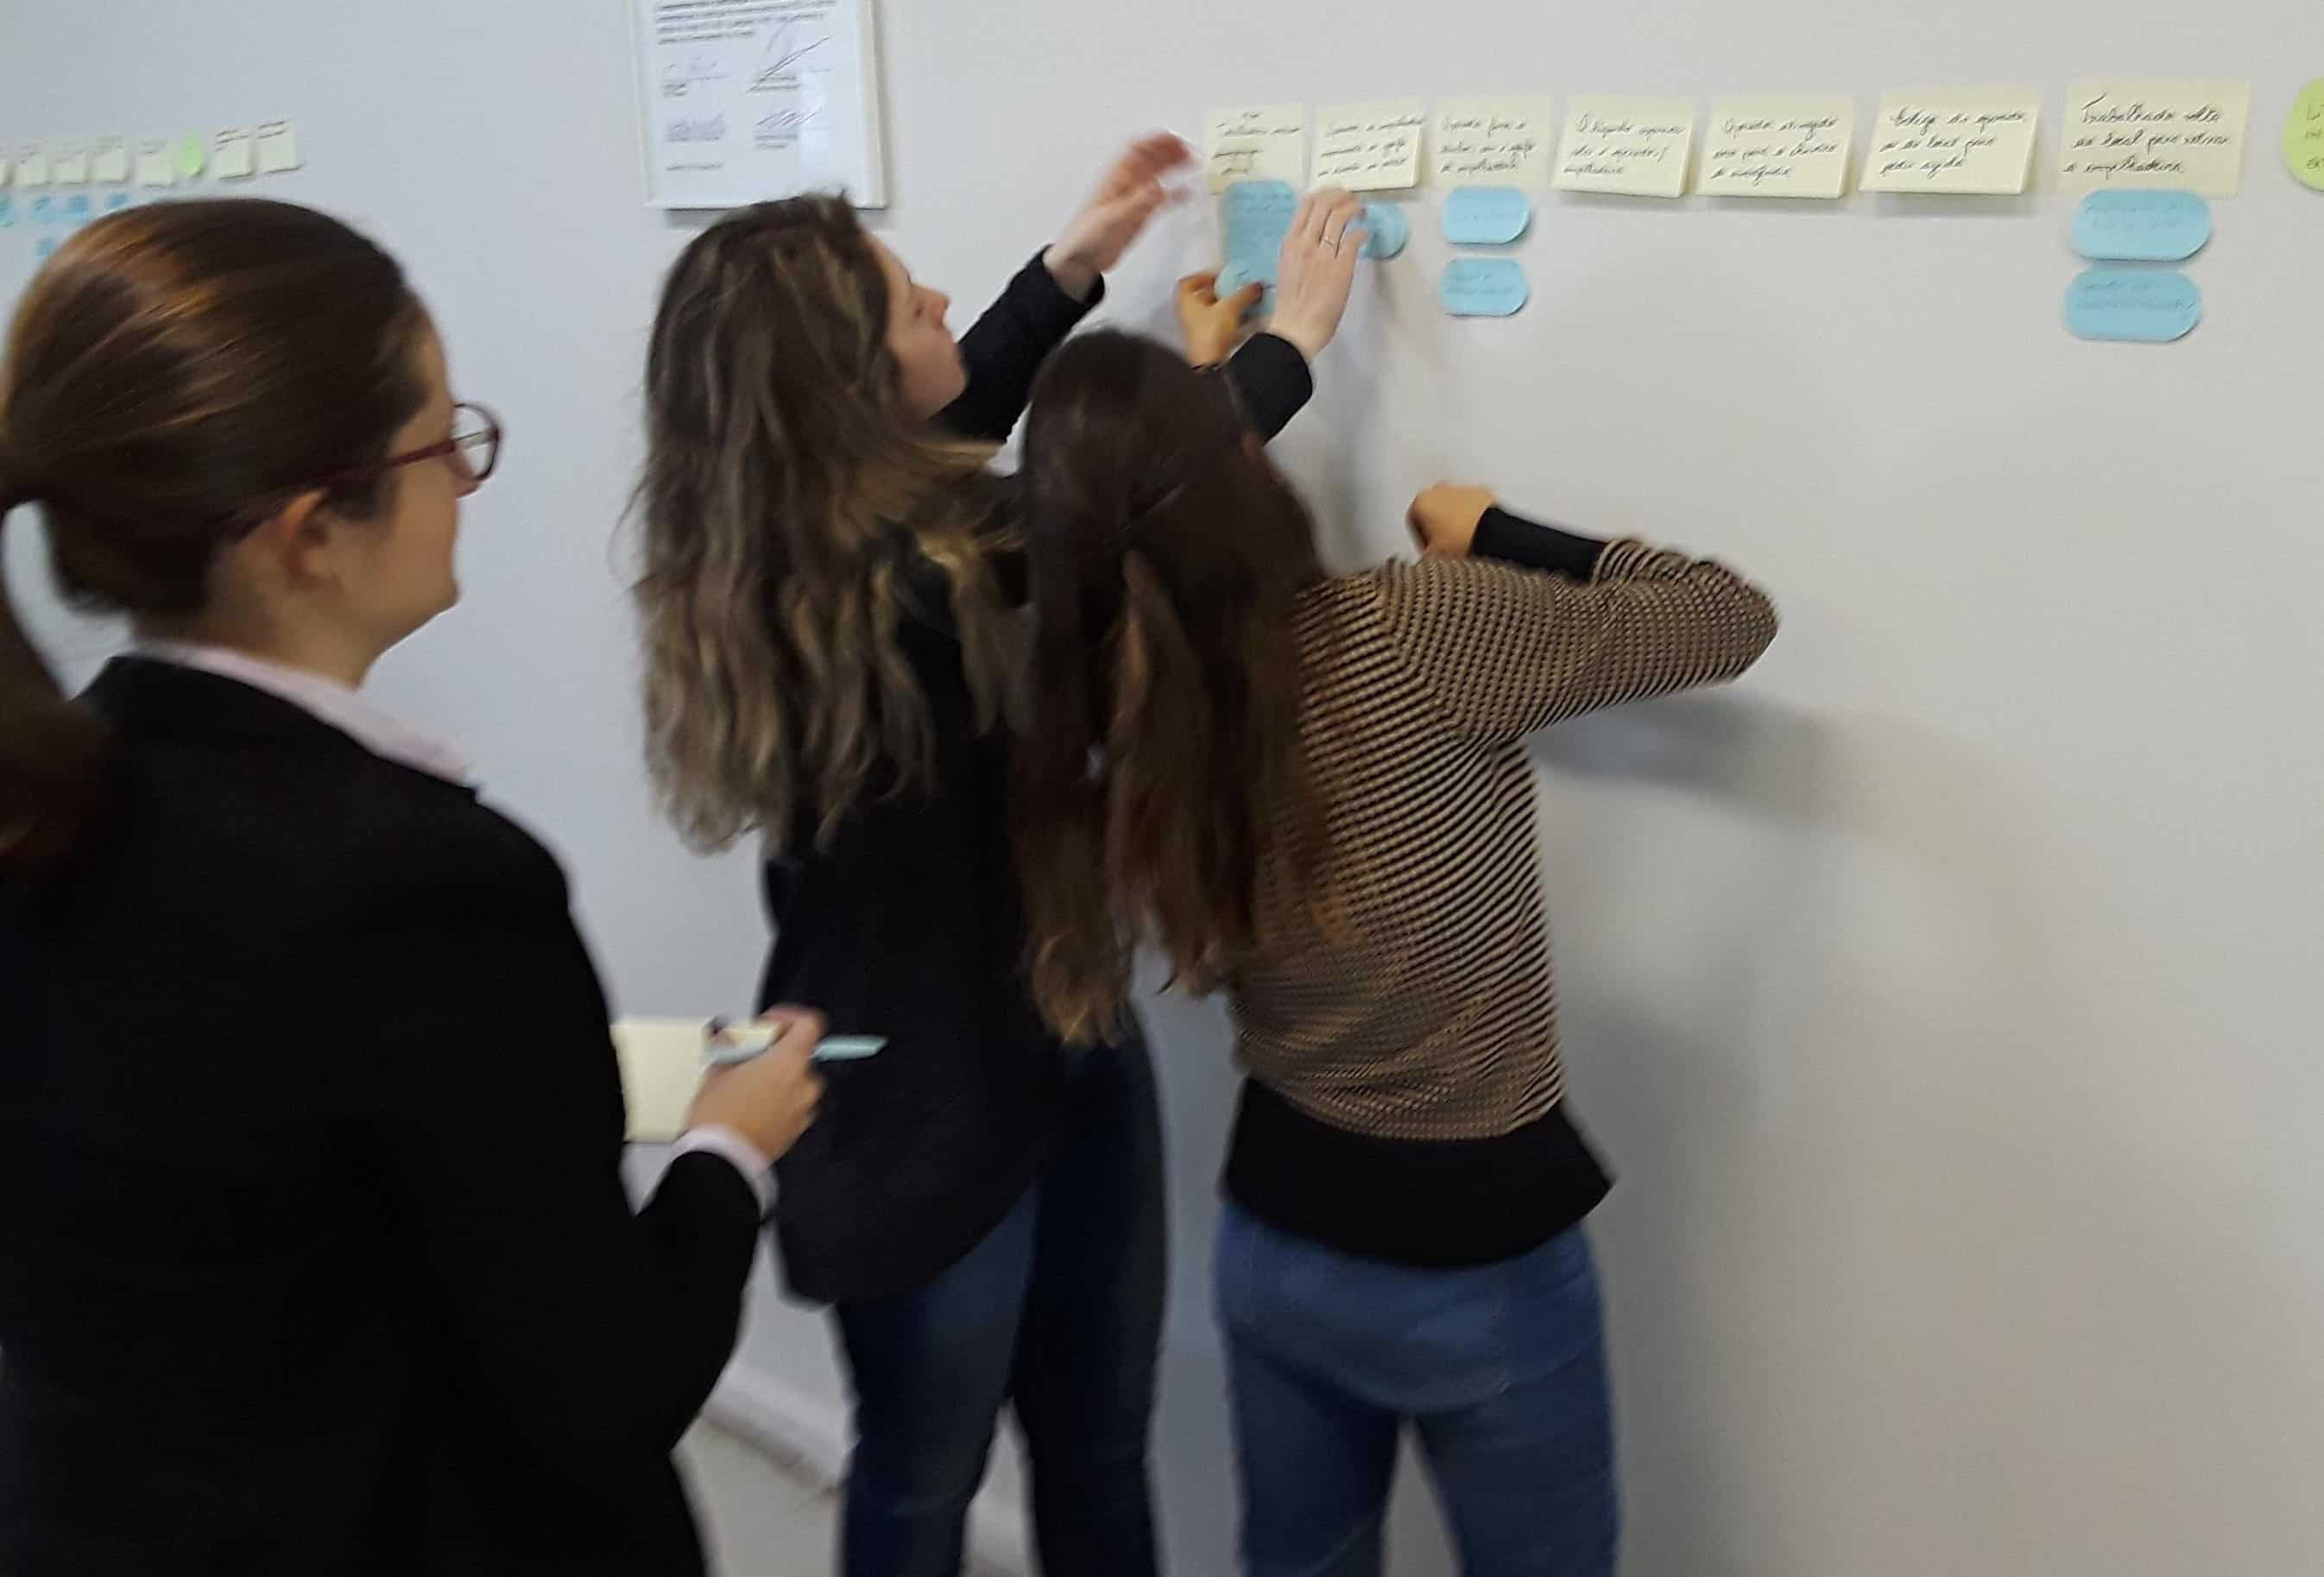
In TapRooT® Root Cause Analysis, a SnapCharT® is the visual timeline of what happened in the incident or event you are investigating. The SnapCharT® provides a clear picture of what happened and clarification of the incident/event so you can understand and identify all the areas of potential improvement. It can also be used as a planning and data collection tool.
If you’re a TapRooT® User, you know that drawing a SnapCharT® is the first step in your investigation, whether it is for a low-to-medium risk incident or a major Investigation.
The SnapCharT® is a simple yet effective tool to help the investigator get started with the investigation
The first steps of the TapRooT® process are planning the investigation, collecting information/evidence, and understanding what happened. The investigator draws a SnapCharT® to understand what happened and to organize the information about what happened. Early versions of a SnapChart® will be very simple. Build your SnapCharT® with the information you have. It honestly won’t have much data, but that’s OK; it’s only your starting point. The rest of your investigation is going to depend on the data you gather in that SnapCharT®, so it is critical that you begin in a simple, methodical manner.
You will undoubtedly have missing information in your SnapCharT®
You will fill in missing information from evidence collection and with answers gained through interviews. Remember, the best way to collect unbiased evidence is to gather evidence from each of the four categories: people, physical, paper and recordings—also referred to as “3 Ps and an R.” Each piece of evidence collected will lead you to the truth of the incident so that you can identify problems and analyze root causes for effective corrective actions. Spend time here to move through the analyzation phase efficiently.
Also, if you have not been to a 5-Day TapRooT® Advanced Root Cause Analysis Training Course, consider enrolling in the TapRooT® webinar, How to Conduct Effective Interviews for Incident Investigations.
Other steps and tips include:
-
- Have conditions detailing the events. A s/c with 0 conditions is an indication of incomplete. Answers to our dictionary questions like to live in the conditions. “What do we know about each event?”
- Remove blame focus in our SnapCharT®
- Why?
- How?
- Use on action and 1 verb per event avoid “and”
- Use active voice opposed to passive voice to provide clarity
- Example, “Pump 2B stop button is pushed by Operator A vs Operator A pushes 2B stop button
- Be specific and precise
- Quantify – instead of “hot,” inform that the temperature was 100 F
- Be neutral and objective
- Do not use judgmental statements
Don’t know how to create a SnapCharT®? . . . We can teach you!
Contact us for onsite training at info@TapRooT.com or view our public courses.
Already trained in TapRooT®? You can start your SnapCharT® with this link to our Software Academy SnapCharT®.
Join us every Wednesday at 12:00 pm for a new TapRooT® TV video premiere
Remember, tune in via YouTube or Facebook Live at 12:00 pm every Wednesday for a new TapRooT® TV video premiere. Find the TapRooT® podcast channel on iTunes, Stitcher, and more.


Hi I’m trained in taproot and have used the Snapchart quite a bit, but now I’m in a situation where i will be taking leave and need other members of my team who are listed as users to edit my Snapchart, how can I allow them access to edit because it keeps showing that I have it locked and they are only able to preview it. I have set the snapchart to shared for editing with them but still get the error.