How Do You Measure Significant Injury and Fatality Improvement?
For TapRooT® Clients, significant injuries and fatalities are rare events. Therefore some of our clients have asked …
How do we measure improvement?
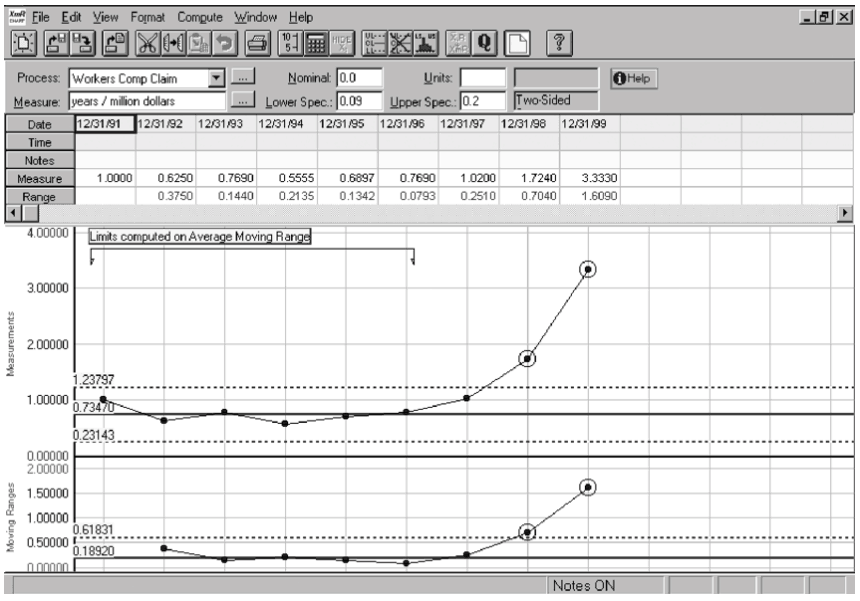
Standard trending just doesn’t seem to work because the statistic (fatalities and significant injuries) occur so rarely. (See a typical graph of infrequently occurring data below).

The answer is two types of specialized XmR Charts. The Interval Process Behavior Chart and the Rate Process Behavior Chart. An Example of a Rate Process Behavior Chart is shown below.

You can use these types of graphs to see if significant improvement or a significant decline in performance has occurred. You can also project the number of days without a SIF to prove that you have improved.
Would you like to learn these types of advanced trending techniques? See this LINK to find out more about the 2-Day Measurement, Trending, and Predictive Analytics: How to Best Use Data to Improve Work Course that is being held on April 24-25, prior to the 2023 Global TapRooT® Summit that is being held at the Margaritaville Lake Resort, Lake Conroe, near Houston, Texas (April 26-28).