Book 8: TapRooT® Performance Measures and Trending for Safety, Quality, and Business Management
Book 8: Trending
Book 8 of the ten-book TapRooT® Book set is:
TapRooT® Performance Measures and Trending
for Safety, Quality, and Business Management.
It provides the advanced trending knowledge you need to:
- Spot areas needing improvement
- Know if changes are just random variations or are significant trends (positive or negative)
- Spot trends in infrequently occurring data
This book builds on the knowledge from the 2008 TapRooT® Book (shown below).

The new book helps you avoid Mark Twain’s quote:
Figures often beguile me,
particularly when I have the arranging of them myself;
in which case the remark attributed to Disraeli
would often apply with justice and force:
“There are three kinds of lies:
lies, damned lies, and statistics.”
Mark Twain (1835–1910)
Author – Mark Paradies

Mark Paradies, President of System Improvements, has 42 years of experience in high-reliability organizations, process safety, incident investigation, and root cause analysis. His career started as a leader in Admiral Rickover’s Nuclear Navy (where he earned Engineer Qualification). He also worked for DuPont in the areas of human factors, process safety, and performance improvement management before he started System Improvements in 1988. He has a BS in Electrical Engineering and an MS in Nuclear Engineering (with an emphasis on human factors), both from the University of Illinois. He learned advanced trending techniques from one of his clients, Ed Peterson, from three classes taught by Dr. Donald Wheeler, and by reading books from W. Edwards Deming and Dr. Walter A. Shewhart.
Trending Book Chapters
The eight chapters in this book include:
- What Does BAD Trending Look Like?
- What is a Performance Measure?
- Trending: What and Why?
- Dot Maps
- Pareto Charts
- Trends Over Time – The Process Behavior Chart
- Special Process Behavior Charts
- Using Measures & Trending
Chapter 1: What Does BAD Trending Look Like?
You have probably seen many examples of bad trending. Many (most?) examples of trending that you see in newspapers or on TV are bad examples. We start with bad examples because you need to break away from the bad habits that you may have adopted because bad trending is all that you see.
Sometimes the graphs are just plain wrong (like the one below).

Is 13% really bigger than 34%?
This chapter is just to get you thinking. The rest of the book shows you how to make graphs that really work!
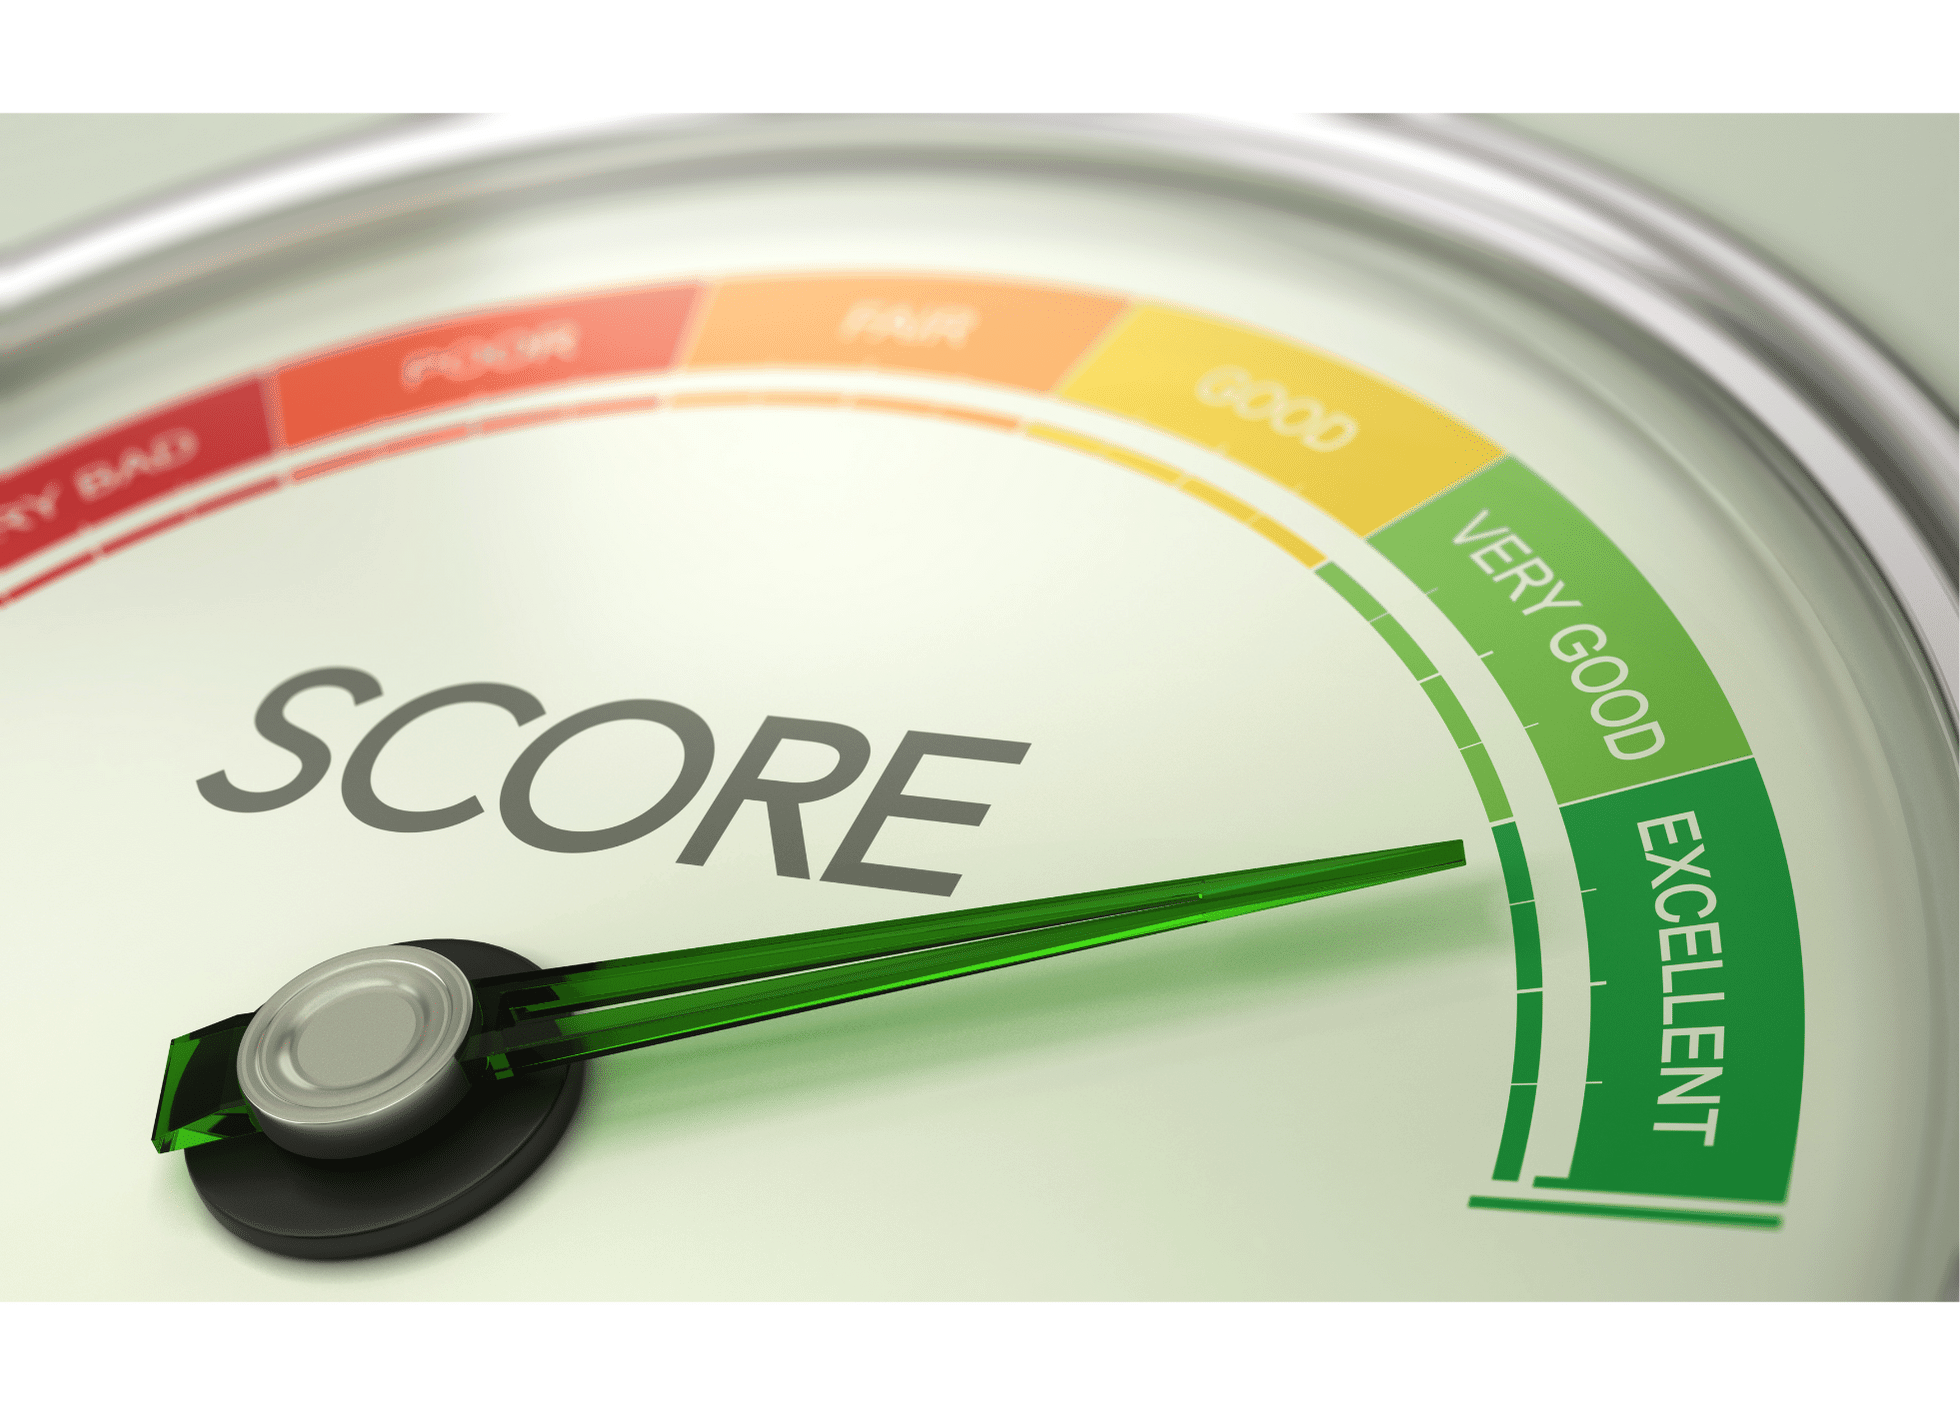
Chapter 2: What is a Performance Measure?
What is a measure?
- When drag racing, it’s the time to reach a quarter-mile.
- When playing basketball, it’s the score.
- When growing corn, it’s the number of bushels per acre.
- When taking a test, it’s the number of points out of 100.
- When measuring safety performance, it’s the lost time injury rate.

Since the beginning of recorded history, measures have been used. Why? They let us compare performance and see how we are doing. Most performance measures are related to outcomes. They are reactive (you measure what happened, and then you react).
As many leadership gurus have said:
What gets measured gets done.
Experts agree that measuring performance is essential for performance improvement
All sorts of measures can be used to evaluate all sorts of performance. For example, what sorts of measures have you seen used to evaluate:
- industrial safety,
- equipment reliability,
- product or service quality,
- production efficiency,
- process safety,
- morale,
- profits,
- product development time,
- environmental stewardship, or
- public safety?
You need good measures to:
- evaluate performance,
- make “mid-course” corrections,
- decide if improvement is needed, and
- evaluate your improvement program.
This chapter will give you many good examples of performance measures to help you develop effective measures for your business needs.
Chapter 3: Trending: What and Why?
Many people think they can spot a trend by simply looking at a graph. However, Dr. Walter Shewhart’s work at Bell Labs proved that people can’t “eyeball” trends (Economic Control of Quality of Manufactured Product, D. Van Nostrand Company, 1931). If you try to manage by eyeballing trends, you actually make the process worse. This is the first way that trending gets a bad name.
How should trending be used? You should use statistics properly to measure performance, select targets for improvement, and detect significant trends.

This chapter explains what should be trended and why so that you avoid knee-jerk reactions based on simple graphs like the one above.
Usually, knee-jerk reactions actually make performance worse. This chapter explains why.
This description of what to trend and why will help you use the tools in the next four chapters to apply simple and advanced trending to guide your business.
Chapter 4: Dot Maps
These are the simplest graphs that you can apply.

This chapter explains how to use them and provides practical examples.
Chapter 5: Pareto Charts
Pareto Charts are another simple but powerful tool.

In 1897, Italian economist Vilfredo Pareto observed that 80% of the wealth in Italy was held by 20% of the people. He found similar results in other countries. This observation has since been generalized to what we now call the “80/20 Rule” (or 90/10) or the “Pareto Principle.” But there is much more to Pareto Charts than this simple fact.
This chapter explains the secrets behind the proper use of Pareto Charts, how they are frequently misused, and how you can use them effectively.
Chapter 6: Trends Over Time – The Process Behavior Chart
A trend is usually described as a performance measure changing over time. You can have positive or negative trends, and you can learn from both types. But you need to understand some advanced but simple math to really understand trends over time.
The advanced trending graphs taught in this chapter are called Process Behavior Charts. They look like the graph shown below.

This chapter explains the math, the charts, and how you can use them.
Chapter 7: Special Process Behavior Charts
Do you need to trend infrequently occurring data? Accidents or other problems that happen less than a few times a month? Then you need to learn to use the Rate and Interval Process Behavior Charts that are explained in this chapter.
These charts are probably the most valuable and least understood charts that safety and quality professionals need to use to spot real negative trends and to prove that performance is improving.
Chapter 8: Using Measures & Trends
This chapter teaches you the five fundamental ways to use performance measures and trending:
- Plot outcomes data (reactive measures) from important processes.
- Use Pareto Charts and Process Behavior Charts together to analyze root cause data and process measures that have been weighted by cost ($$$) to look for Big Hitters (low-hanging fruit).
- Trend proactive performance measures for important processes
- Trend all root causes of your incidents using Process Behavior Charts.
- Check to see if improvements actually impact reactive (outcomes) and proactive (audit/observation) measures.
The chapter shows you trending examples and helps you build your trending program.
How Do You Buy this Book?
Simple! Go to THIS LINK and place your order!

Or buy the whole 10-book set here:
https://store.taproot.com/taproot-books-1-10-book-set

Trending Training
We also have a course titled:
Measurement, Trending, and Predictive Analytics:
How the Best Use Data to Improve Work
The course covers advanced trending techniques and using the techniques to improve work at your site. The course materials include the Trending Book. To get more information about the course, CLICK HERE.
To see our public courses, CLICK HERE.
CONTACT US to get a quote for a Trending Course at your site.