Categorization of Incidents (Three Safety Pyramids)

Part of the TapRooT® Software is the ability to set up custom categorization fields for incident/accident reports. Many companies categorize incidents as safety, quality, maintenance, production, and/or environmental.
The idea I will share here is another way to categorize SAFETY incidents.
In one of our past Summit talks, we shared that three separate pyramids make up the major accident pyramid – an auto safety pyramid, an industrial/occupational safety pyramid, and a process safety pyramid.

In other words, instead of one pyramid like the one above (from Heinrich’s book, Industrial Accident Prevention, 3rd edition, 1950), there are actually at least three pyramids like the one above – one for auto accidents, one for industrial accidents, and one for process safety accidents.
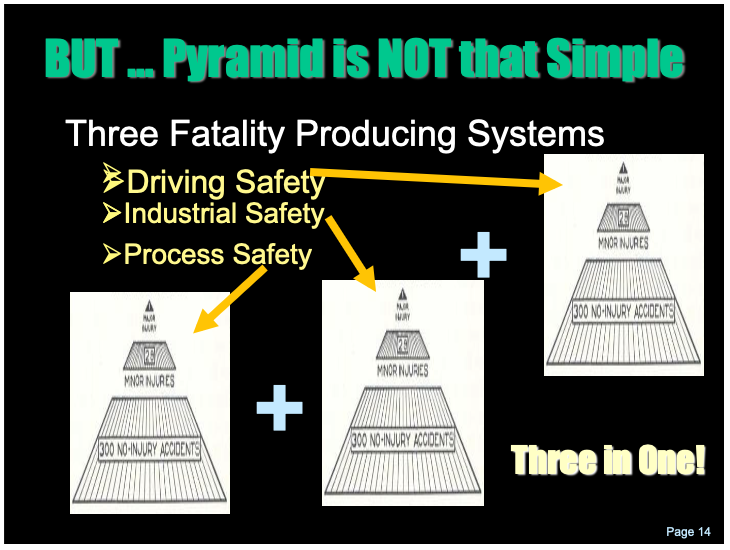
Each pyramid is summed up in the total “safety” data.
Why is this important? Because each of these pyramids is produced by different systems. When you add them up, you are summing unlike systems and “muddying” your data.
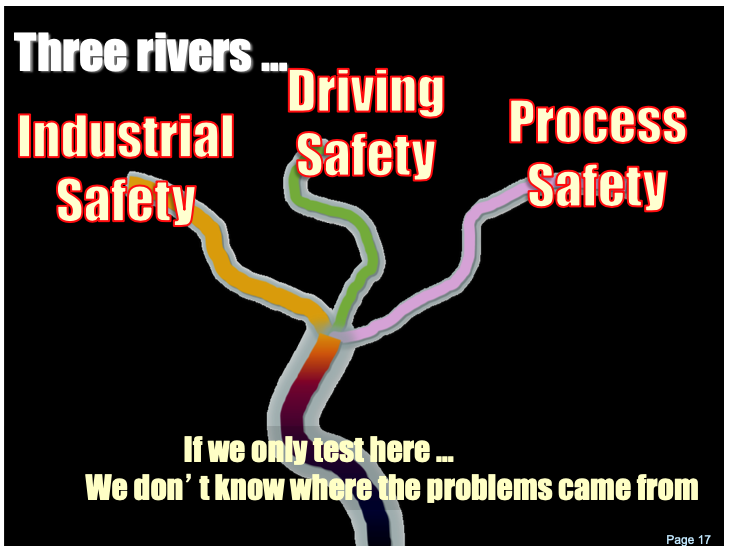
What do I mean by this? A trend in auto and industrial safety getting safer may mask a trend in process safety getting worse. This is especially true because the major accidents in process safety are so few and far between, and the “minor injury” and “no-injury incident” equivalents in process safety may seem so minor.
In other words, you should not try to trend all three systems at once. You should trend each safety system – auto, industrial, and process – separately.
That’s why you need to keep track of these statistics separately by categorizing them in your safety data.
By the way, if BP had done this before the Texas City refinery explosion, they could have detected separate trends in their various systems (auto, industrial, and process safety) that resulted in overall employee safety.
Thus, you should be trending driving safety, industrial safety, and process safety incidents separately.
Does this make sense?
Would you like to learn more about trending safety statistics (and other types of performance statistics)? Then you need to attend the Measurement, Trending, and Predictive Analytics: How the Best Use Data to Improve Work Course being held prior to the 2023 Global TapRooT® Summit. The course is scheduled on April 24-25. The Summit is being held on April 26-28. REGISTER for the course HERE. Register for the course and the Summit and SAVE $300 by CLICKING HERE.
If you have questions, leave comments by clicking on the comments button below.


I have been trying to find additional data on someone’s rebuttal of the safety pyramid that I think I saw in your website. Researchers had discovered that major accidents occur for entirely different reasons than minor accidents an merely taking care of minor accidents will not ensure that major accidents won’t happen. Do you recall this research?
Maybe it was this article about the diamond concept…
https://www.taproot.com/deciding-when-to-investigate-precursor-incident/
Thanks for sharing the article mark.
You’re welcome.