TapRooT® FAQ – Creating Your UNIQUE Trending Report
Welcome to our new Technically Speaking FAQ series. Here you will find answers to frequently asked questions from our customers.
QUESTION: Can I create my own unique trending reports with the data I’ve collected in the TapRooT® VI software?
ANSWER: YES!!!
The TapRooT® VI software has several Trending options.
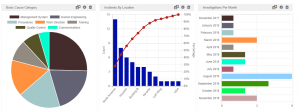
You can always visit the Dashboard to create different “Widgets” (a.k.a. charts) based on a variety of different criteria. Just go to TRENDS > Dashboard to choose from a large list of different options.
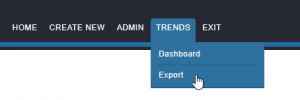
BUT… you can also create your OWN trending reports using our Export feature. Just go to the TRENDS > Export option and you can export “raw” data from the software that can be downloaded in a spreadsheet format that you can use to create your own custom tables, charts, lists, etc.
There are endless possibilities on what you can do!
Did I mention that using the Export feature, we have ALREADY built in the capability to see Process Behavior Charts??? (look on the bottom of the export sheet to view!)
TECHNICALLY SPEAKING is a weekly series that highlights various aspects of the TapRooT® VI software and occasionally includes a little Help Desk humor. REMEMBER, JUST BECAUSE IT’S TECHNICAL, IT DOESN’T MEAN IT HAS TO BE COMPLICATED!