Kevin Teaches Performance Measures and Trending
Moneyball and Statistics
Did you ever watch the movie Moneyball? Geek assistant manager Peter Brand taught the Oakland Athletics Manager, Billy Beane (played by Brad Pitt), how to use performance measures and trending to improve the team’s performance and win their division.
Here is a video about the movie…
Sometimes Kevin McManus Feels Like Peter Brand
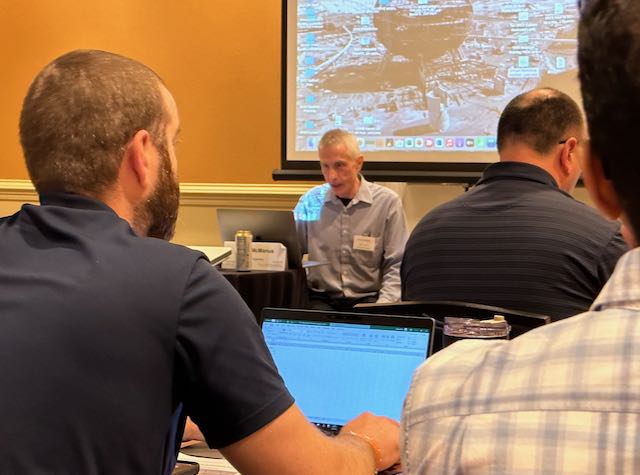
Why would our contract instructor, Kevin McManus, feel like the geek Peter Brand of Moneyball? Because he teaches the Measurement, Trending, and Predictive Analytics: How the Best Use Data to Improve Work Course. And that course teaches advanced trending techniques that can help your company improve performance.
Who is Kevin McManus, and why is he qualified to teach you advanced trending techniques? As Chief Excellence Officer of Great Systems LLC, Kevin McManus provides virtual coaching and content to help people use proven best practices to enhance and optimize their daily work systems. Over forty years of work experience in roles such as Industrial Engineer, Training Manager, Production Manager, Plant Manager, and Director of Quality give Kevin a ‘real life work’ perspective relative to daily work process optimization, work team engagement and empowerment, and sustainable operational excellence.
As a contract trainer for the TapRooT® root cause analysis process, Kevin has taught over 450 courses and further enhanced his ability to help leaders proactively minimize risk, reduce errors, and improve reliability. Kevin holds an undergraduate degree in Industrial Engineering and an MBA. He served as a national Malcolm Baldrige Performance Excellence Award Examiner for twenty years, including a three-year term on the national Judge’s Panel. Kevin has authored the monthly performance improvement column for Industrial and Systems Engineer magazine for over 20 years, is an Institute of Industrial and Systems Engineering Fellow, and has been a member of IISE for over forty years.
What’s Taught in the Course?
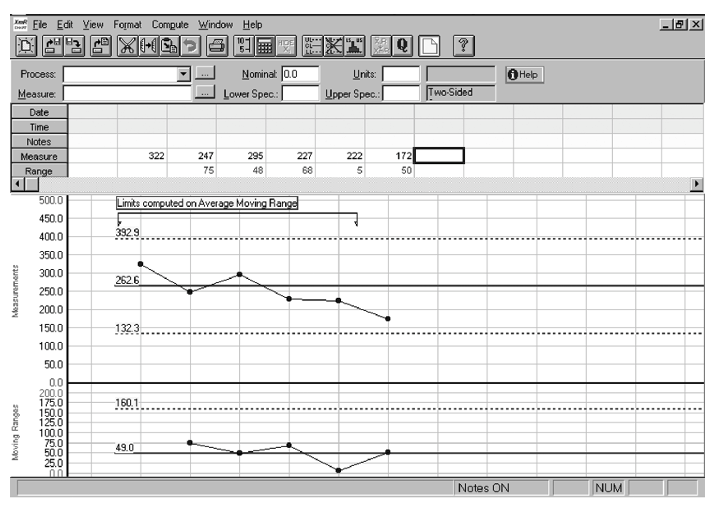
Some of the techniques you have probably heard of … for example, Pareto Charts. Some of the techniques you probably have not heard of … for example, Process Behavior Charts. But even with the techniques you have heard about, you may not know some secrets and tricks to make them even more effective. Like the Interval Process Behavior Chart.
You will also learn to…
• Identify leading counts and ratios that best reflect the ‘vital signs’ of process performance
• Set up a simple process to capture and crunch daily process information
• Review and use measurement results daily to predict, anticipate, and improve performance
• Recognize and engage team members in effective daily measure use
• Select options to improve the design of your existing measurement work system
Do You Need to Improve Your Company’s Performance?
Would you like to learn how to develop measures and trends to help you know where to apply your improvement efforts to get the most bang for the buck? Would you like to be able to tell real trends from fake trends (everyday process variation)? Then attend the upcoming Measurement, Trending, and Predictive Analytics: The Best Ways to Use Data to Improve Performance being held at Knoxville, Tennessee on September 29-30, just before the Global TapRooT® Summit (October 1-3, also in Knoxville).
Don’t miss this chance to learn advanced trending skills.
To register for the course, CLICK HERE. To register for the course and the Summit and SAVE $300 off the combined course and Summit fee, CLICK HERE.