Trending Performance “Bad Practices” Recommended as “Best Practices”

Trending Performance Gone Bad
I was looking for trending best practices from the nuclear industry. Instead of finding industry best practices, I found lots of bad practices that were recommended as best practices.
OH NO!
What happens if you adopt bad practices and implement them? You get bad results! And those bad results are trending malpractice! Malpractice means that you will waste effort responding to trends that don’t exist and miss trends that do exist.
I won’t say which nuclear industry experts recommend these bad practices, but be careful when accepting advice about trending. Why? I’ve seen lots of bad advice out there (and little good advice) in all sorts of industries. For example, I attended a course held by a professional society about trending, and the instructor couldn’t explain why certain techniques should or should not be applied to particular types of data.
Trending Performance Bad Practices

What did Mark Twain have to say about bad trending practices?
Figures often beguile me,
particularly when I have the arranging
of them myself; in which case the remark
attributed to Disraeli would often
apply with justice and force:
“There are three kinds of lies:
lies, damned lies, and statistics.”
Let’s talk about just a few of the trending bad practices recommended by nuclear industry experts…
1) PARETO CHARTS: They mentioned Pareto Charts but didn’t mention the 80/20 rule (Pareto Principle) that Pareto Charts are based on and how to use the rule to choose which targets to attack first. This could lead to choosing items to improve that are NOT that significant.
2) PIE CHARTS & MATRIXES: They recommend pie charts and matrixes to analyze data. I would never recommend using these. The appropriate Pareto Chart would be much better (and you only have to learn a single analysis method).
3) TRENDING OVER TIME: For trending over time, they recommended a mixture of techniques, including making “trend lines” with linear, second-order, third-order, and fourth-order polynomial approximations. This will keep you busy with math and lead to false trends and management knee-jerk reactions. (Just what you are trying to avoid.)
4) FALSE QUALITY CHARTS: A couple of experts recommended graphs that looked like an XmR Chart (Process Behavior Chart), but they didn’t provide the proper mathematical methods for setting the Upper Control Limit (UCL) (Upper Process Limit).
They said:
“The UCL for each trending category and subcategory is set by mutual agreement
between the trend group and the line organization responsible for the program,
process, or issue that category or subcategory represents. Organizations typically
started with initial UCL calculated based on the mean over a specified time frame
(usually 18 months) plus two standard deviations above the mean…”
“
Ahhh! This is exactly what Dr. Deming said NOT TO DO. Management arbitrarily sets and then changes limits (mutual agreement).

Dr. Walter Shewhart
The three-sigma limits (one sigma more than recommended above) were proven by extensive testing and application back in the 1930s by Dr. Walter Shewhart. They were taught, applied, and proven by Dr. Deming in a wide variety of manufacturing environments.

Dr. Donald Wheeler
Three sigma limits have been accepted by quality experts worldwide, including Dr. Donald Wheeler, from whom I learned the basis for these three-sigma limits. Once again, they were proven to work well.
Why would nuclear industry experts choose a different basis for their limits – making them tighter – and not explain how they derived them? As shown by Dr. Shewhart and Dr. Wheeler, this suggested new, tighter limits will produce more “false alarms” and more knee-jerk reactions by management and regulators.
5) NO RECOMMENDATIONS FOR INFREQUENTLY OCCURRING DATA: The nuclear industry experts didn’t recommend appropriate techniques for trending infrequently occurring data. Without proven techniques to measure trends in infrequently occurring data, management can miss serious negative trends or think they have spotted trends in infrequently occurring data when no trend is present.
What Troubles Me So…
Why are these bad practices so troubling?
Because by now, these nuclear utility experts should have learned real best practices – advanced trending techniques – for trending performance. After all, nuclear industry professionals are supposed to be good at math. And this math isn’t hard to learn.
These experts shouldn’t be promulgating bad practices.
For over two decades, we have taught advanced trending techniques based on scientific foundations and the accepted mathematics of Dr. Deming, Dr. Shewhart, and Dr. Wheeler. By now, every nuclear plant should have someone that clearly understands these advanced trending techniques and has explained them to their management.
Yet these nuclear plant trending “experts” still recommend these bad performance trending techniques. Others may hear their recommendations and may think about implementing them.

OH NO!
Learn Real Best Practices
Where can you learn real trending best practices? The advanced trending techniques to help you understand and improve your facility’s performance? In this pre-Summit course:
2-Day Measurement, Trending, and Predictive Analytics:
How to Best Use Data to Improve Work
Don’t miss this course that is only offered once a year at the Global TapRooT® Summit pre-Summit Courses. The 2023 Global TapRooT® Summit is coming up on April 26-28, and the pre-Summit Courses are on April 24-25. Both are being held at the Margaritaville Lake Resort, Lake Conroe, near Houston, Texas. Register for the pre-Summit Course and the Summit and learn proven best practices.

This Course is NOT Just for Nuclear Trending Professionals
Also, please don’t think that this course is ONLY for trending nuclear plant performance. These trending best practices will work in any industry. We’ve had attendees apply these advanced trending techniques at:
- Mines
- Hospitals
- Oil Platforms
- Oil Refineries
- Chemical Plants
- Government Agencies
- Manufacturing Facilities
- Utilities (nuclear/fossil/transmission & distribution)
Just to name a few.
If you need to understand what your trends are telling you (including trends in your root cause, safety, quality, manufacturing/production, and equipment data), then this is the course for you.
The course will be taught by Kevin McManus.

Kevin is a performance improvement expert with over 40 years of experience, including experience as a Plant Manager, Industrial Engineer, Training Manager, Operations Manager, Continuous Improvement Manager, Quality Manager, and Performance Improvement Coach. Kevin has over 20 years of experience as a national Malcolm Baldrige Performance Excellence Award Examiner, including a three-year term on the national Judge’s Panel. Kevin has taught over 430 TapRooT® Courses (and counting) as a contract trainer for the TapRooT® Root Cause Analysis System, further enhancing Kevin’s ability to help leaders proactively minimize risk, reduce errors, and improve reliability. Kevin holds an undergraduate degree in Industrial Engineering from the University of Arkansas and an MBA from Southern Illinois University.
Class Size is Limited – Register Soon!
Class size is limited. REGISTER early! And also, register for the 2023 Global TapRooT® Summit and SAVE $300 off the course price.
Bring a team to pre-Summit Courses and the Summit and SAVE even more!

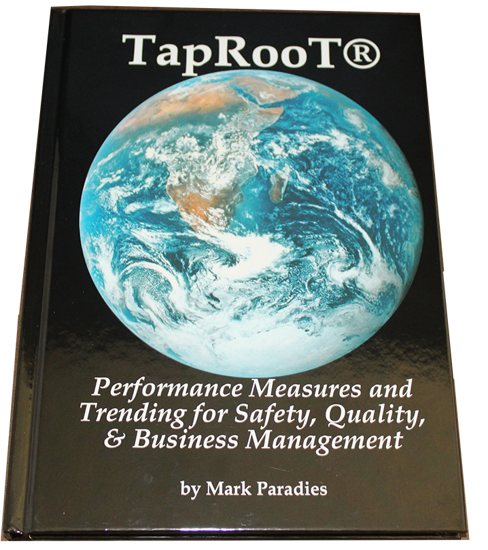
Read the Trending Book
The book below is included with the trending course materials. if you can’t make the class, at least read the book. Order it by clicking on the picture below.