How is TapRooT® Root Cause Analysis Different? (Best)

Asking the Wrong Question
Someone asked me:
“How is TapRooT® RCA different from other root cause analysis tools?“
While answering the question, I concluded that it was the wrong question. The question should have been:
“Why is it that so many industry leaders have chosen TapRooT® RCA
to be their standard for finding and fixing the root causes of problems?“
It’s not what makes TapRooT® different … It’s what makes TapRooT® clearly superior that should be the focus of the question and my answer. Or maybe even more simply,
“Why is TapRooT® Root Cause Analysis the best?“
Some people just don’t get this line of questioning. They say:
“Every technique has its advantages and disadvantages.“
They just don’t understand that people can’t be trained in every technique. Companies can’t afford to train everyone to be a guru problem solver.
Companies need a “best answer.” A root cause system that has been intelligently designed to meet the needs of the people in the field. People who are doing real investigations. A system that companies can adopt as a standard.
The techniques in this standard system need to be “human-factored” – designed with the limitations and capabilities of the human analyst in mind.
Best Because – TapRooT® Root Cause Analysis Design
When designing the TapRooT® System, Mark Paradies and Linda Unger not only used the human factors expertise that Mark brought to the development but also worked with outstanding human factors experts (including Dr. Charles O. Hopkins, Smoke Price, and Dr. Paul Haas).
They human-factored the TapRooT® System to make it usable. That makes it superior.
But the development efforts didn’t stop there.
Mark got reviews and comments from safety and reliability experts from many industries, including aviation (Jerry Lederer, father of aviation safety), nuclear power and nuclear weapons (Larry Minnick, nuclear plant safety expert), and the oil/petrochemical business (Heinz Bloch, equipment reliability guru).
Those named above are just a sample … not an exhaustive list. There were many more TapRooT® Users who helped in the early TapRooT® development efforts.
This intelligent design made the TapRooT® System grow beyond one philosophy. Beyond a single industry perspective. The intelligent design made the TapRooT® System superior (the best root cause analysis system).
Best Because – Going Beyond Root Cause Analysis
The design went beyond a root cause analysis system. The TapRooT® System is an investigation and improvement process that includes built-in human-factored root cause analysis tools and equipment troubleshooting tools.
Many root cause analysis tools are tacked on to already complete investigations. They are missing the power of the techniques to help the investigator collect and evaluate evidence.
That’s why the TapRooT® System is not just root cause analysis. The TapRooT® System is root cause analysis meshed with information collection, troubleshooting, causal factor identification, and corrective action development. The TapRooT® System is an investigation and performance improvement process (both reactive and proactive).
The whole system works together seamlessly. That’s different and superior!
Best Because – Stops Jumping to Conclusions
I don’t want to give away all the secrets that make TapRooT® superior, but I will share a few more that should help people trying to decide if they should attend TapRooT® Training.
First, unlike many root cause analysis tools (think 5-Why’s or any cause-and-effect-based system), TapRooT® doesn’t start out looking for “why” something happened. Instead, it starts out trying to understand “what” happened.
That’s a key difference that provides a great advantage.
One of the big drawbacks of many systems is that people using them jump to conclusions about why something happened before they understand what happened. It’s a natural human tendency. In fact, the more knowledge someone has about a topic, the more likely they are to think they automatically know the right answer. They jump to a conclusion.
In a TapRooT® Investigation, an investigator’s first goal is to build a complete SnapCharT® Diagram.

A SnapCharT® Diagram visually shows what happened and as much information as can be gathered about the factors that surrounded what happened. This is prior to looking for root causes.
You might notice that the SnapCharT® Diagram above is very similar to an example 5-Why analysis that Taiichi Ohno used to teach 5-Whys. If you would like to see an article that compares 5-Whys to TapRooT® RCA, CLICK HERE.
TapRooT® Users find this initial focus a major advantage because it helps them avoid the “blame trap” and the trap of jumping to conclusions.
That makes TapRooT® RCA superior.
Best Because – Guided Root Cause Analysis
The next major advantage of TapRooT® Root Cause Analysis is the way that the TapRooT® Root Cause Tree® Diagram guides investigators to the root causes of causal factors.
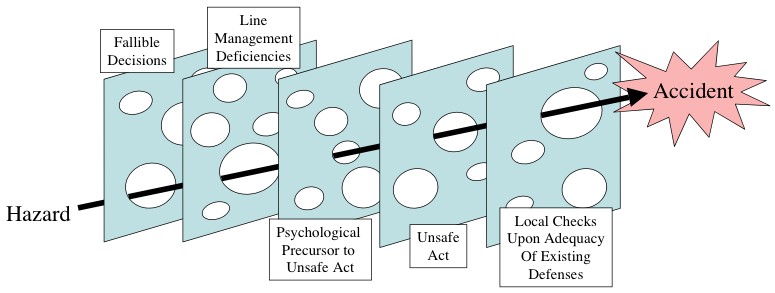
The TapRooT® System doesn’t depend on the falling dominoes model.

The designers of the TapRooT® System understood that accidents have multiple causes that existed before the initiation of the accident. Before the accident, these causes never came together in exactly the “wrong” way at one point in time to cause the accident. People may call this coincidence “bad luck.” Engineers and statisticians may think of using Monte Carlo methods to simulate the seeming randomness of real life. Or, as Dr. James Reason (creator of the Swiss Chees Model) called them: latent causes.
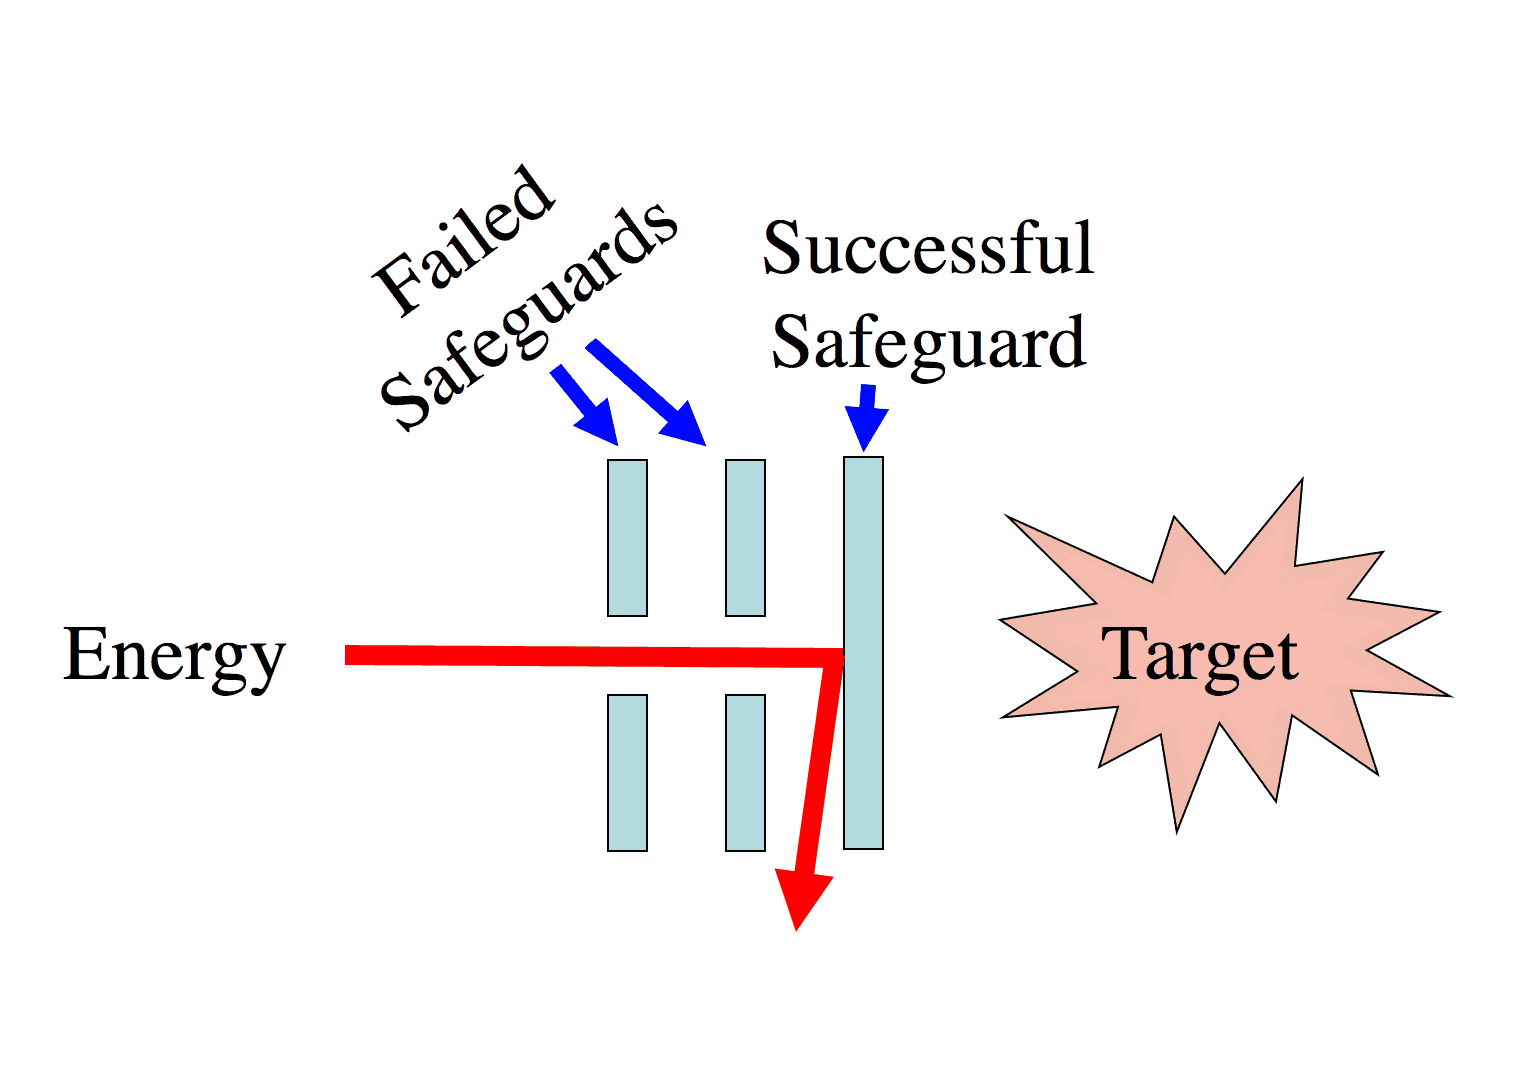
Because of this, the TapRooT® System encourages investigators to identify all the causal factors and to find each causal factor’s root causes. Thus, there isn’t a “root cause” for an accident. Rather, there are multiple root causes for each causal factor that contributes to an accident.
Think about the multiple causes as multiple opportunities to improve performance by improving multiple defenses to prevent accidents.
The tool used to analyze these causal factors is called the Root Cause Tree® Diagram. It is copyrighted and, in software form, patented. It is human-factored to lead investigators to the root causes of human performance and equipment problems. Nobody has anything close to our tree.

To learn more about the advantages of guided root cause analysis, CLICK HERE.
Best Because – Helping People Go Beyond Their Current Knowledge
“THINKING IS THE HARDEST WORK THERE IS,
WHICH IS PROBABLY THE REASON WHY SO FEW ENGAGE IN IT.”
Henry Ford
Some say that the goal we set out for the Root Cause Tree® Diagram to guide people to root causes is impossible. They say it is impossible to include ALL the causes of human error in a model. Instead, they say that one should begin with an open mind and analyze each problem from scratch to discover the incident’s root causes by thinking hard.
There are two problems with this belief.
FIRST, the human brain thinks categorically. For example, the language used to describe an accident is based on words (categories). So even if you try to start with an open mind, your brain is already categorizing.
We have found that most investigators have no specialized training in human factors. Therefore, they don’t know what they should be looking for (they don’t have the categories in their brain). This makes it almost impossible for them to identify the causes of human errors and develop effective corrective actions.
That’s why they revert to the standard answers of blame (counseling and discipline solutions), training, and, when all else fails, writing a procedure. It’s not that these answers are always wrong. It is that these answers are just a small fraction of what needs to be done to improve human performance.
The Root Cause Tree® Diagram provides a much more complete answer. We wanted to capture 90 – 98% of the root causes of human error in the categories on the tree. And based on 30 years of use, our users say that we have done a pretty good job.
SECOND, we never said the Root Cause Tree® Diagram has all the answers.
The Root Cause Tree® Diagram is just the best list we’ve ever seen. We think it is closer to the 98% end of the scale than to the 90% end. And we know it is much more complete than the answers in the models carried in the heads of investigators. Thousands of users that we train each year tell us that TapRooT®’s Root Cause Tree® Diagram expands the universe of problems they can find and solve. It does not restrict their problem-solving efforts.
Having designed the TapRooT® System, I could go on with other major and minor advantages that we’ve worked so hard to incorporate into TapRooT® RCA. But I’ll stop here with one more reason that the TapRooT® System is superior…
Best Because – Continuous Improvement
We started with a great design, but we didn’t stop. We have spent over 30 years improving the TapRooT® Root Cause Analysis System.
We continue to search for and implement ideas that make TapRooT® RCA even better. This includes ideas from international experts, our instructors, and our TapRooT® Advisory Board (60+ people from industry-leading companies).
Better training, better software, and better techniques.
Continuous improvement keeps TapRooT® Root Cause Analysis state-of-the-art and makes it superior.
Time to Make TapRooT® RCA Your Standard
Of course, there are more advantages to using the TapRooT® Root Cause Analysis System – reasons why industry leaders worldwide have standardized on just one method of root cause analysis. By now, you are probably thinking…
“Why haven’t we standardized on the BEST root cause analysis –
the TapRooT® System?”
That seems like a great idea.
Get started by attending our TapRooT® Training.
See the complete schedule of our public TapRooT® Training at:
https://store.taproot.com/courses
Or call us at 865-539-2139 or CLICK HERE to get a quote for a course at your site.

TapRooT® Courses come with a money-back guarantee:
Attend a TapRooT® Course. Go back to work and
apply what you have learned. If you don’t find
root causes that you previously would have overlooked,
and if you and your management don’t agree
that you develop better corrective actions
that are more effective, just return the course
materials, and we will refund the entire course fee.
That’s how confident we are that you will see the difference and agree that the TaRooT® System isn’t just different; it’s superior.
TapRooT® Users Keep Learning
Those that already use TapRooT® RCA don’t stop after a single course. They keep up with the latest TapRooT® RCA improvements to sustain their programs and build on their success.
How? They attend the Global TapRooT® Summit to hear from great Keynote Speakers and participate in best practice sharing. For information, see: